"In God we trust; all others must bring data" Dr. W. Edwards
Deming
In
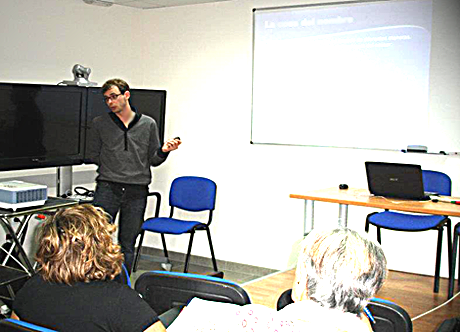
my last TP post I wrote about how you can teach with almost no material resources and in this one I'd like to show just the opposite, how you can use in a sensible way some of the huge amount of resources currently provided by the
ICT. There are many websites, blogs and even apps which may help you to prepare materials, to decide teaching strategies and to support your work. The few times I have had the chance to teach myself I have relied heavily on powerpoints, dynamic graphs and maps. I have also made internet research about the subject (no matter I had it very clear in my mind), keeping an open-minded approach not only because I am a novice (which I clearly am) but because you may find extraordinary tools. Today I'm speaking just about two sites I've already used. However, before starting I'd better say two important things: firstly, these resources are
a support to your lessons, but they can't substitute the teacher, it's important that you prepare yourself properly for every lesson and that you don't rely
too much on your PPT or your internet connection. Questions will be asked and you ought to be ready to clearly explain them. Secondly, it's important that you adapt the resources you find to your objectives and to the stages you are working with, because a messy explanation may be worse than no explanation. Once these two warnings have been issued, let's go to the resources:
Gapminder.org: the beauty of stats
Gapminder is a website offering very nice resources. In my lessons of introductory economics to nurses (yeah, I know it sounds weird, it was nice, though) I used them to show some of the stats relating
health and wealth,
HIV and children by woman. They are very useful to start debates about the underlying causes behind some issues, and doing it from the scientific approach of data. However, they can be used at any level of teaching and they have this beautiful stuff about life expectancy:
We all know what life expectancy means, only that... do we know? Well, we know that it is an economic indicator very often used to measure the health of a society, and thereby, the development level of a country, but most people, specially young students, tend to think about it like if everyone in let's say Rwanda was going to live more or less 56 years, which is their current life expectancy. And everyone in the UK about 80. Of course this is the wrong way to interpret the indicator. Life expectancy is an
average and, thus, it rather reflects
how hard is to arrive to be old in a country, how easy is to die before your time. The guys in gapminder.org have prepared a powerpoint that explains it very clearly. Highly usable. It's worth to take a look:
http://www.gapminder.org/downloads/life-expectancy-ppt
Worldmapper.org: Put your stats on a map
 |
| This is a demographic-corrected UK map |
We are used to see statistics in number or in graphics. And we are used to physical and political maps of the world. In the
worldmapper website we can find maps reflecting statistics. I really like them, they set a very interesting point of view, specially regarding to international development statistics such as poverty, GDP, health, education... they are somehow impressive when you compare different regions and they give you a different sight of both the world and your surroundings.
 |
| An adaptation I made of two worldmapper.org maps to provoke debate among students: the red one is the world sized by GDP, the coloured one is the world sized by people who lives with less than 1$ a day |
Of course, this two are samples I knew about because I had used them before to teach. You could also explain the carbon footprint and let the kids
calculate their own one; there is plenty of sites with Maths or English games... it's up to you to use these resources and make learning a bit funnier.